
A look back at 2024 in the lens of S&P/TSX sector indices
2024 was, by most accounts, a fantastic year in the Canadian financial markets, as seen by S&P/TSX Composite Indexʼs* total return of 21.7%. The total return is comparable to the S&P 500Ⓡ Index that performed slightly better with a 23.3% return¹. In this article, we will reflect on the Canadian equity market this past year through the lens of the 11 sector indices within the S&P/TSX Composite Index.
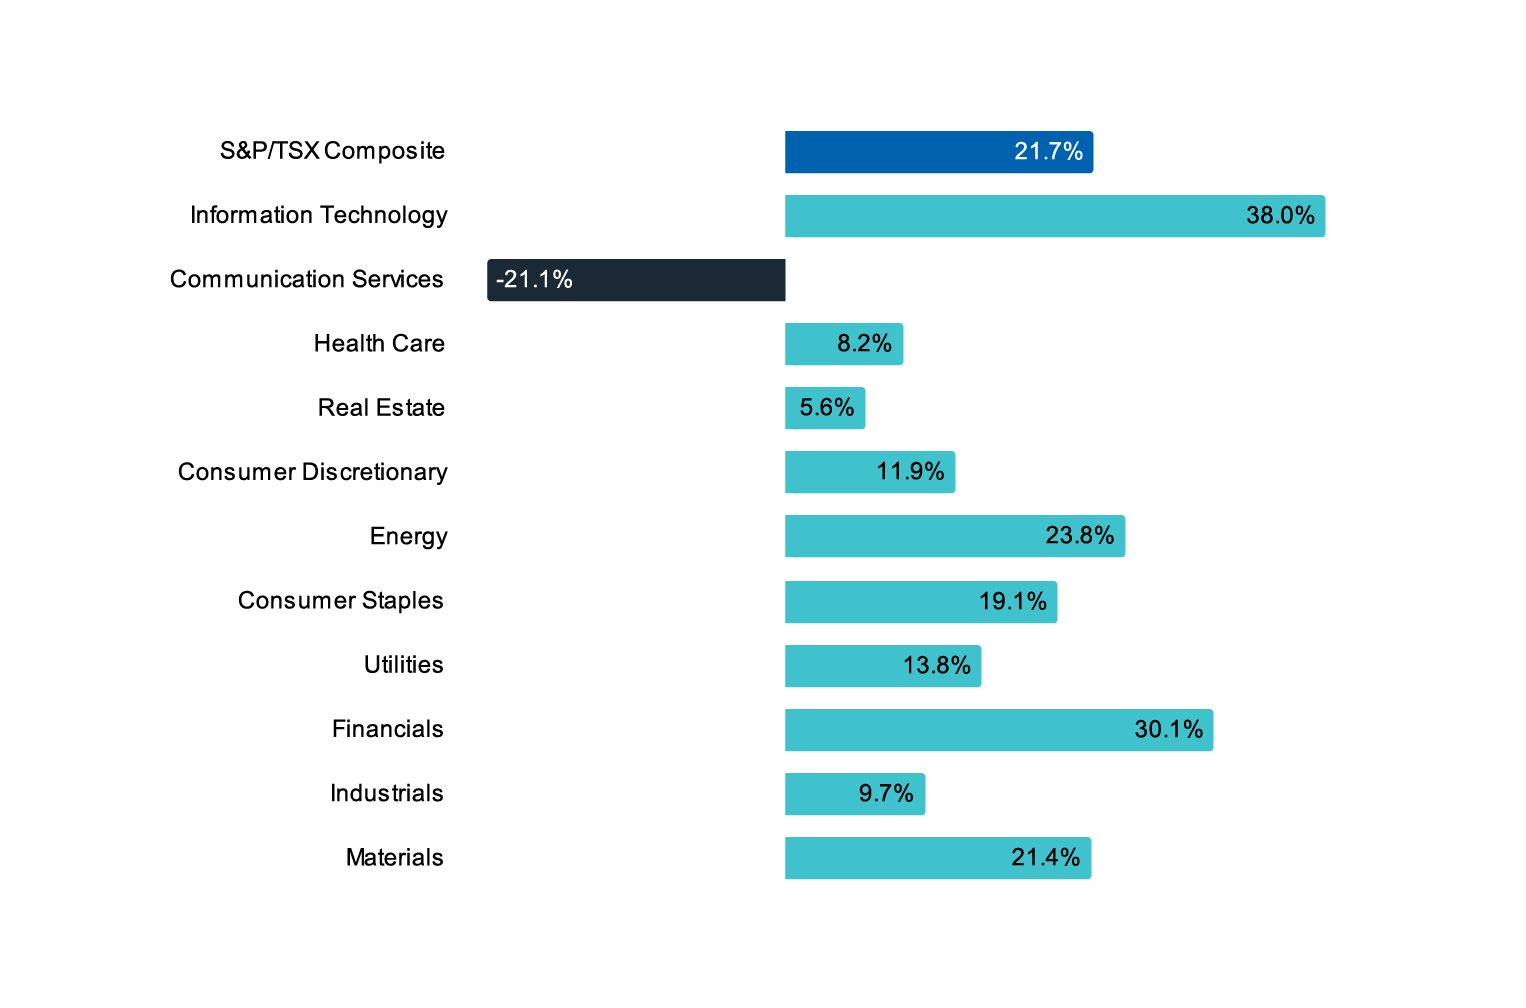
EXHIBIT 1: S&P/TSX Sectors - Total Return 2024
Based on Exhibit 1, we can clearly see that some sectors have risen to the top. Overall, all sectors returned positively, with the exception of Communication Services, which experienced a sizable loss of 21%. This downturn wasnʼt attributable to a single constituent but rather an industry-wide decline.1 On the flipside, Information Technology and Financials were the top-performing sectors within the Canadian equity markets, both achieving greater than 30% returns in 2024. The eight other sectors all ended on a positive note with an average return of 14.2%. On a macro level, the Bank of Canadaʼs effort in lowering the overnight lending rate from a high of 5% to 3.25% over the second half of 2024 has likely contributed to the positive results of many of the S&P/TSX sectors.
Upon taking a glimpse of year-to-date (YTD) 2025 (mid-February), Information Technology and Materials continued their upward momentum, whereas Health Care and Consumer Staples reversed course. Notably, the Canadian Health Care sector erased all of its gains from 2024 in just two months of 2025. Out of the four constituents in the Canadian Health Care sector, half of them have suffered double-digit losses so far in 2025.¹
¹Source: Bloomberg Finance L.P.
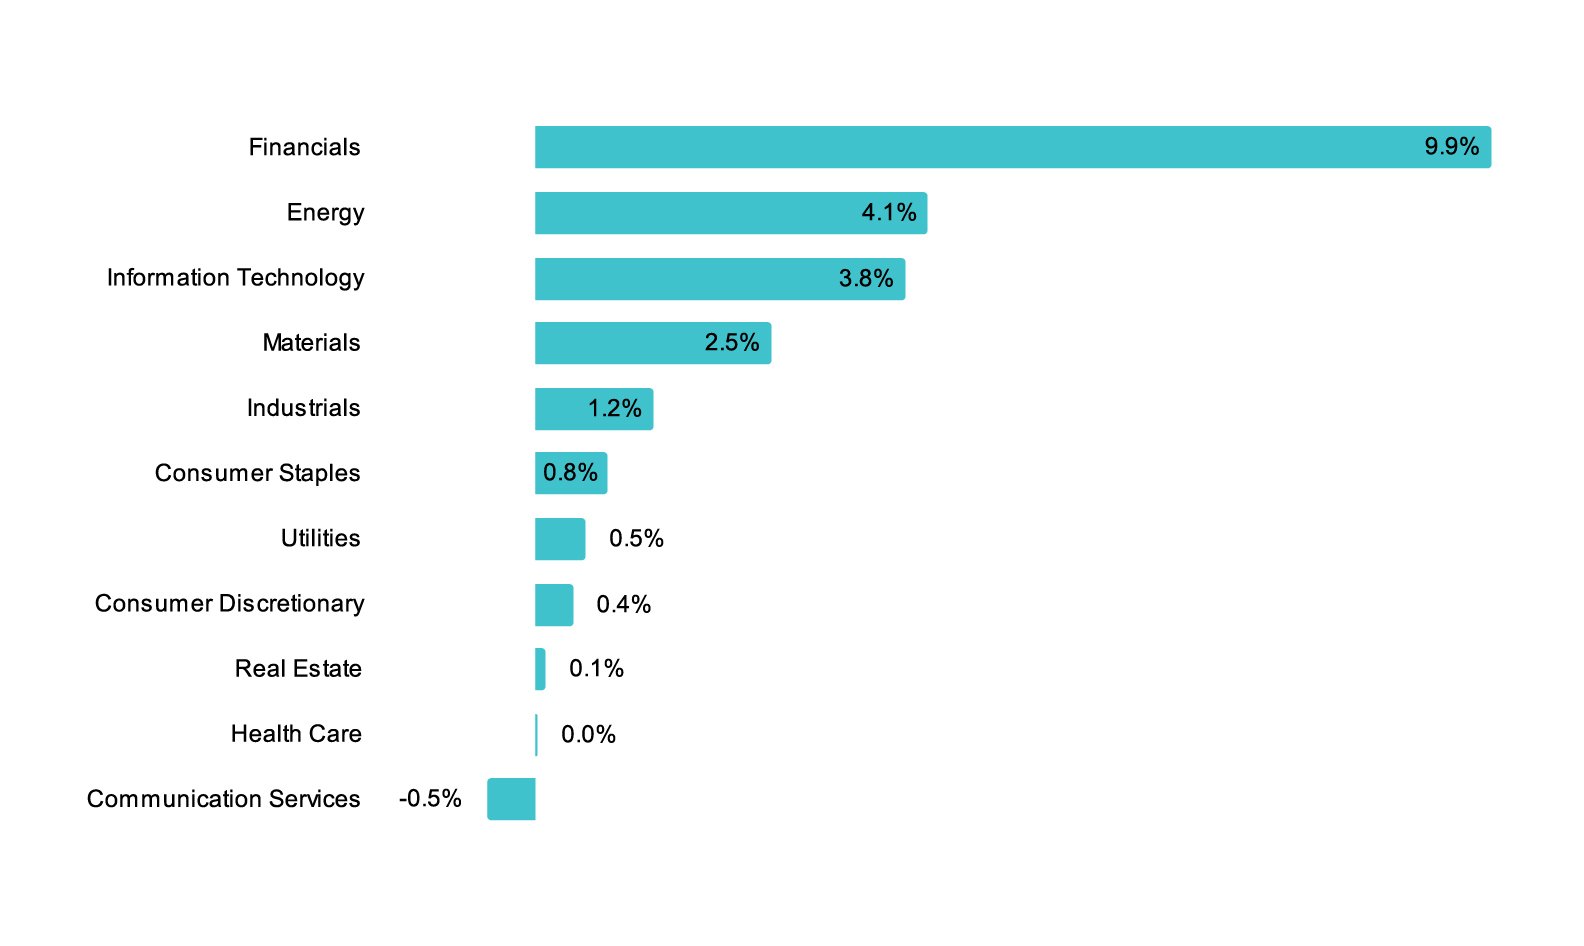
EXHIBIT 2: S&P/TSX Composite Index Total Return Contribution by Sectors
Exhibit 2 observes the return contribution of each sector to the S&P/TSX Composite Indexʼs total return in 2024. As expected, the return contribution was heavily skewed, with the top 3 sectors (Financials, Energy, and Information Technology) accounting for 78% of the total return. Conversely, the bottom 3 sectors (Real Estate, Health Care, and Communication Services) contributed negatively, primarily due to the outsized decline in Communication Services. Despite strong double-digit returns in Materials, Consumer Staples, Utilities, and Consumer Discretionary, the aggregate contribution to total return was less than 20%, as the sector weights in aggregate were not significant.

EXHIBIT 3: 2024 Sector Weights compared to S&P500 (Year end 2024)
Exhibit 3 examines the 11 sector weights across the S&P/TSX Composite Index and S&P 500 Index. The notable difference between the two indices is nothing new, but emphasizes the Canadian equity marketʼs heavy reliance on natural resources sectors and Financials relative to the U.S. From a sectoral perspective, this serves as a good reminder that the two neighbouring markets in North America are starkly different and can act as diversifiers to one another.
All in all, 2024 was a stellar year in the Canadian equity market, and it remains to be seen how 2025 will play out - whether the positive momentum will continue or the bull run will lose its steam.
For more information, please contact TMX Sales at datasales@tmx.com.
For more information about Wall Street Horizon, please visit: https://www.wallstreethorizon.com/
For more information about S&P/TSX index suite, please visit: https://www.tmxinfoservices.com/benchmarks-and-indices/sp-tsx-indices#tsx
Copyright © 2025 TSX Inc. All rights reserved. Do not copy, distribute, sell or modify this document without TSX Inc.’s prior written consent. This information is provided for information purposes only. Neither TMX Group Limited nor any of its affiliated companies guarantees the completeness of the information contained in this publication, and we are not responsible for any errors or omissions in or your use of, or reliance on, the information. This publication is not intended to provide legal, accounting, tax, investment, financial or other advice and should not be relied upon for such advice. The information provided is not an invitation to purchase securities listed on Toronto Stock Exchange and/or TSX Venture Exchange. TMX Group and its affiliated companies do not endorse or recommend any securities referenced in this publication. TMX, the TMX design, TMX Datalinx, TMX Group, Toronto Stock Exchange, TSX, TSX Venture Exchange, and TSXV are the trademarks of TSX Inc. All other trademarks used are the property of their respective owners.
*The S&P/TSX Indices are products of S&P Dow Jones Indices LLC ("SPDJI") and TSX Inc. ("TSX"). S&P® is a registered trademark of S&P Global, Inc. or its affiliates ("S&P"); Dow Jones® is a registered trademark of Dow Jones Trademark Holdings LLC ("Dow Jones"); and TSX® is a registered trademark of TSX. SPDJI, Dow Jones, S&P and TSX do not sponsor, endorse, sell or promote any products based on the Indices and none of such parties make any representation regarding the advisability of investing in such product(s) nor do they have any liability for any errors, omissions or interruptions of the Indices or any data related thereto.
The views and opinions expressed in this article are those of TSX Inc. and do not necessarily reflect the views and opinions of S&P, Dow Jones, or their affiliates.